- *The risk in the intervention group (and its 95 % confidence interval) is based on the assumed risk in the comparison group and the relative effect of the intervention (and its 95 % CI).
-
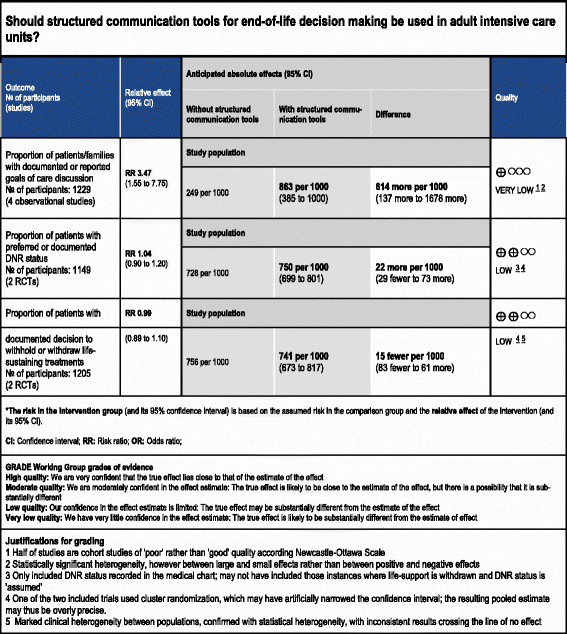
CI confidence interval, RR risk ratio, OR odds ratio, DNR do not resuscitate, RCT randomized controlled trial
- GRADE Working Group grades of evidence
- High quality: we are very confident that the true effect lies close to that of the estimate of the effect
- Moderate quality: we are moderately confident in the effect estimate. The true effect is likely to be close to the estimate of the effect, but there is a possibility that it is substantially different
- Low quality: our confidence in the effect estimate is limited. The true effect may be substantially different from the estimate of the effect
- Very low quality: we have very little confidence in the effect estimate. The true effect is likely to be substantially different from the estimate of effect
- Justifications for grading
- 1. Half of studies are cohort studies of poor rather than good quality according to the Newcastle-Ottawa scale
- 2. Statistically significant heterogeneity; however, between large and small effects rather than between positive and negative effects
- 3. Only included DNR status recorded in the medical chart; may not have included those instances where life support is withdrawn and DNR status is assumed
- 4. One of the two included trials used cluster randomization, which have artificially narrowed the confidence interval; the resulting pooled estimate may thus be overly precise
- 5. Marked clinical heterogeneity between populations, confirmed with statistical heterogeneity, with inconsistent results crossing the line of no effect
